#3 January 2023 Data Release 2 Update
Kinship Issues (review)
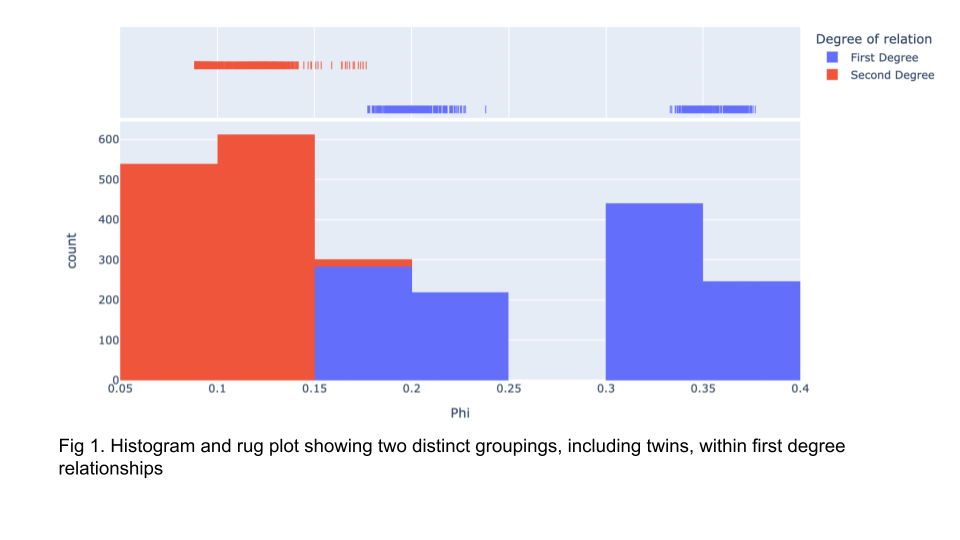
Using the Hail version of king proved useful for our ten thousand sample set in data release 1. Jina provided some coherence checks by showing that all but one set of sample duplicates were indicated as twins, with the outlier as the highest-ranking first-degree sample. New checks were implemented by Paul and myself for this release. I presented (Fig 1) a histogram a few months ago showing a clear separation between first degree samples and twins. While the histogram showed this distinction, many of the twins contained a phi score slightly below that which would indicate it as a twin.
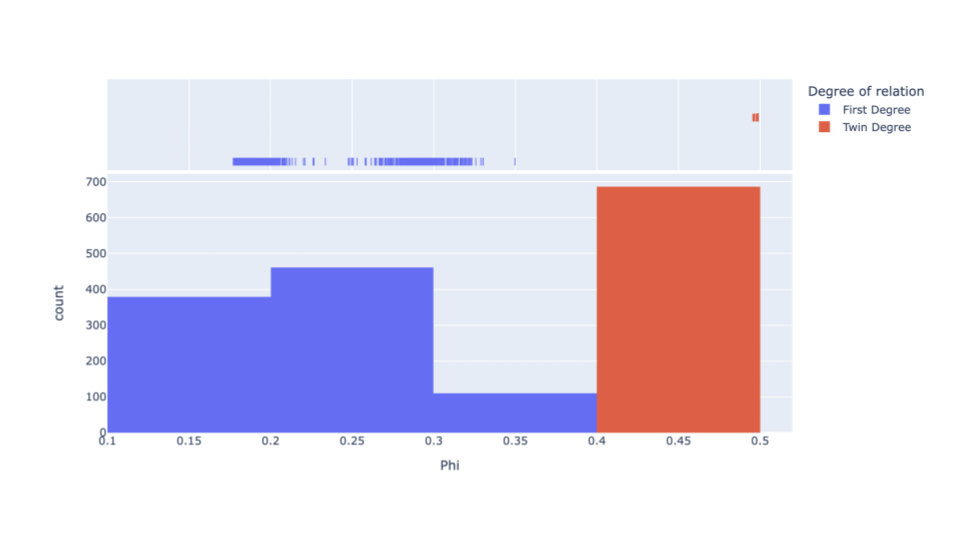
A possible solution that we set in motion was to add additional variant filtering before performing kinship analysis. Our strategy for kinship in data release 1 was to perform kinship analysis immediately before population-based QC. By performing kinship analysis after population-based QC, we hypothesized more accurate results would be obtained. This strategy showed promising results, with all duplicates now within the twin phi score range. However, using this strategy provided an unusually high number of second-degree relationships at 1,838,755,722 (Fig 2).
New Strategies Moving Forward
pc_relate
One strategy moving forward is to implement the Hail version of pc_relate in place of king. This strategy may be more appropriate, as pc_relate is better suited for datasets containing admixture. Preliminary tests are currently underway using the samples from data release 1 as input. These results have resulted in only fifteen related samples, with ten first degree and five second degree (PowerPoint: Slide 1). All first-degree samples estimated by pc_relate overlap with kings first degree samples, while three samples estimated to be second degree samples by pc_relate are predicted to be first degree relationships by king. Subsequent testing with fine tuning of parameters still needs to be done.
Comparison to Boston Results
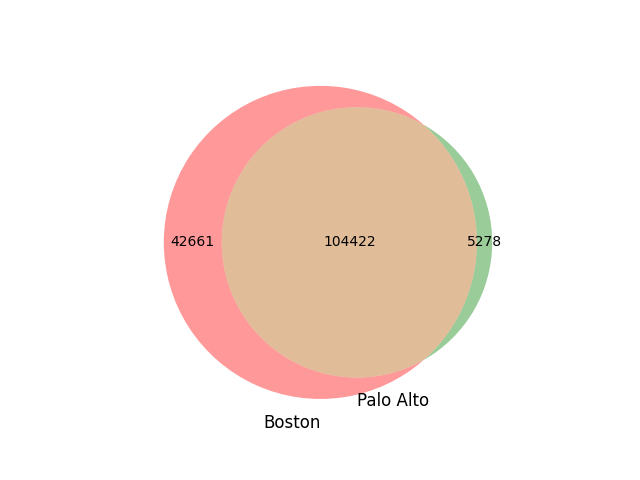
Kinship scores generated by the Boston team have been provided to us. A total of 147,083 samples were analyzed by the Boston team to generate their results. In order to generate an efficient comparison of the datasets, only samples overlapping between both were retained (PowerPoint: Slide2). First- and second-degree sample lists from both Boston and Stanford were filtered based on the overlapping samples and then compared (Fig 3). It should be noted that second degree relationships were not able to be compared due to the high number of relationships that were noted above.
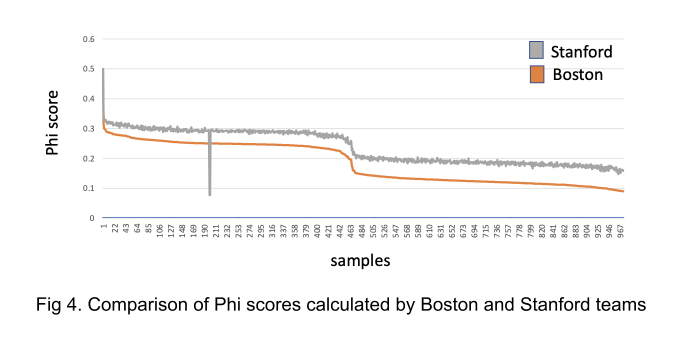
To visualize the differences in phi scores between the Boston and Stanford datasets, the Stanford king results table was filtered to include only samples estimated to have first- or second-degree relationships in either dataset. This was done to filter the large number of comparisons, 12,056,479,204, to a more manageable table that would also be more informative. After filtering, common comparisons between the two datasets were plotted (Fig 4). The results show that the Stanford scores skew higher but follow a similar trend. This consistency in trend gives us validation to use the Boston results for this release while we re-work our methods for future releases.
Boston’s analysis of Stanford’s Genotype Data
Genotype data was converted to VCF file format for each chromosome (python script currently under pull request review) for the Boston team to view. While going over the data, Boston discovered the missingness rate on the X Chromosome is high and the number of variants on the Y chromosome is higher than expected. This brought up the question of whether Jina’s haploid filter updates were implemented. After review, it was determined that they were, suggesting these may be novel issues.
Looking Forward to Release Preparation and GWAS
As we look forward to moving the release process along before I go on paternity leave (coming soon…), I have found there are some issues and files with no resolution or development history.
In a presentation Jina gave before release 1, she described an issue “Samples with GT labels that do not match GT labels obtained from the genotyping” that had no resolution. It is believed she received a list of these samples from the Boston team, and they were removed from the matrix before release. I would like to verify this and inquire how to develop a similar list for this release.
There are also handful of files required for figure generation and GWAS that have no documented source. It is believed that these files may also have been generated by the Boston team. These include.
covid_wgs_covar.20210603.tsv
20210920-covid19-10k-phenotype.csv
wgs_shipping_id_height_20211028.csv
EUR_GWAS.height.glm.linear.tsv.bgz
height_gwas.imputed_snps.WGS_samples.sumstats.tsv.gz
Data Release Tracking
Paul has implemented a Git project to track the progress of data release 2. We can now add and update tasks for more trackable and readily available updates.