#14 MVP Telomere Project Stage 2 - Run Telseq on 100 MVP samples
Updates on telseq with 10 crams
1. Runtime and cost estimation across machine types:
Compared the runtime and cost incurred when running telseq on different machine types. Ideally we would want to minimize the cost incurred per unit. More information on cost and runtime estimation/comparisons can be seen in this markdown file. All comparisons were done by running telseq with the -u flag.
Figure 1 - Per unit runtime across machine types:
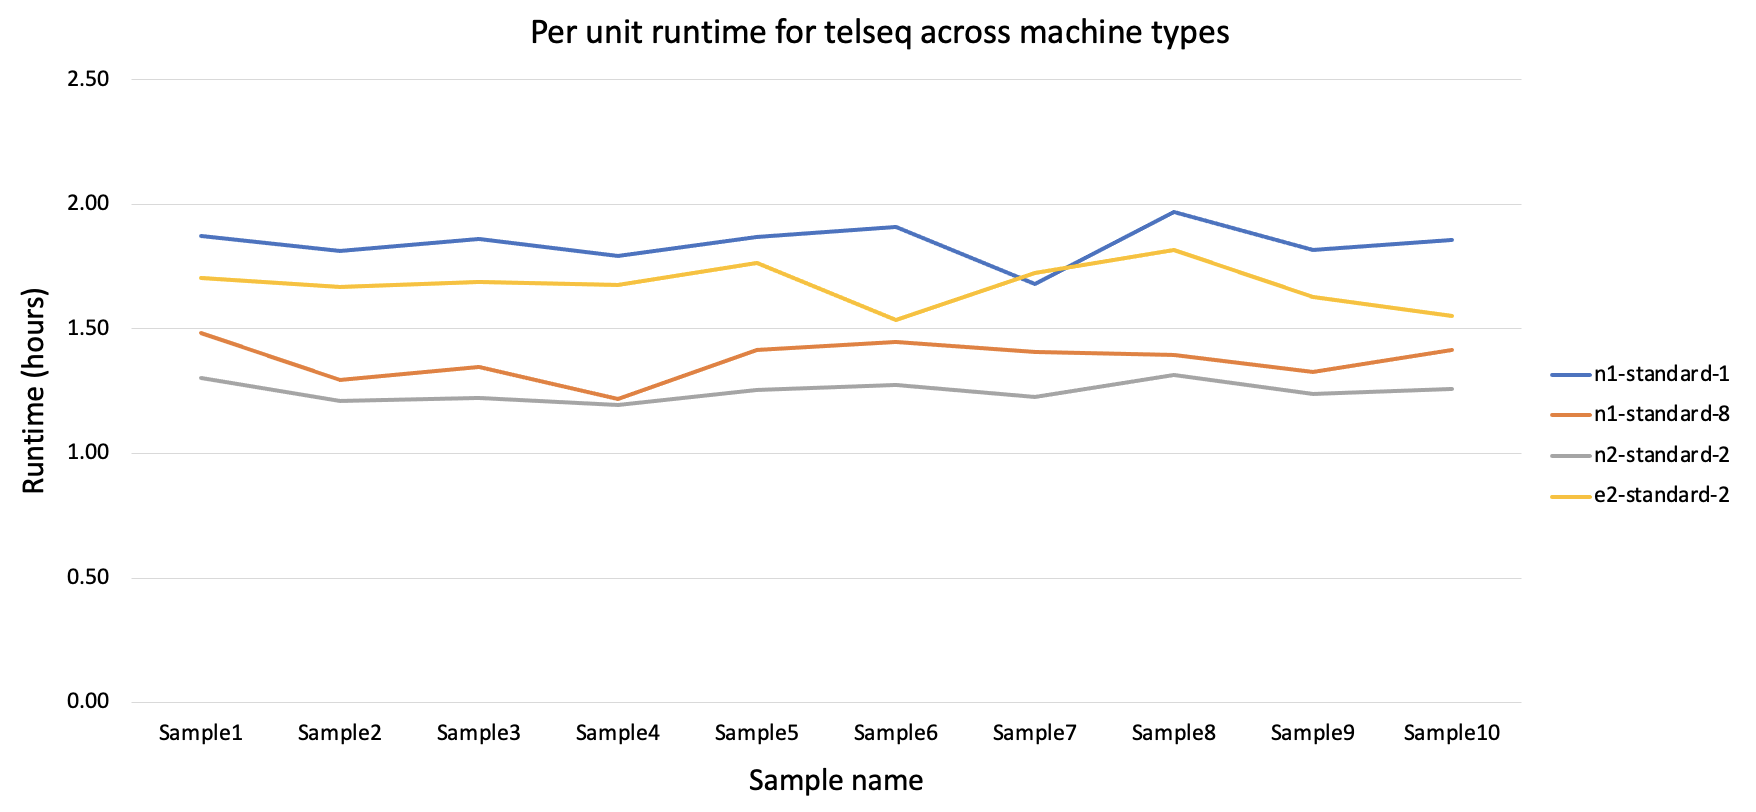
Figure 2 - Per unit cost across machine types:
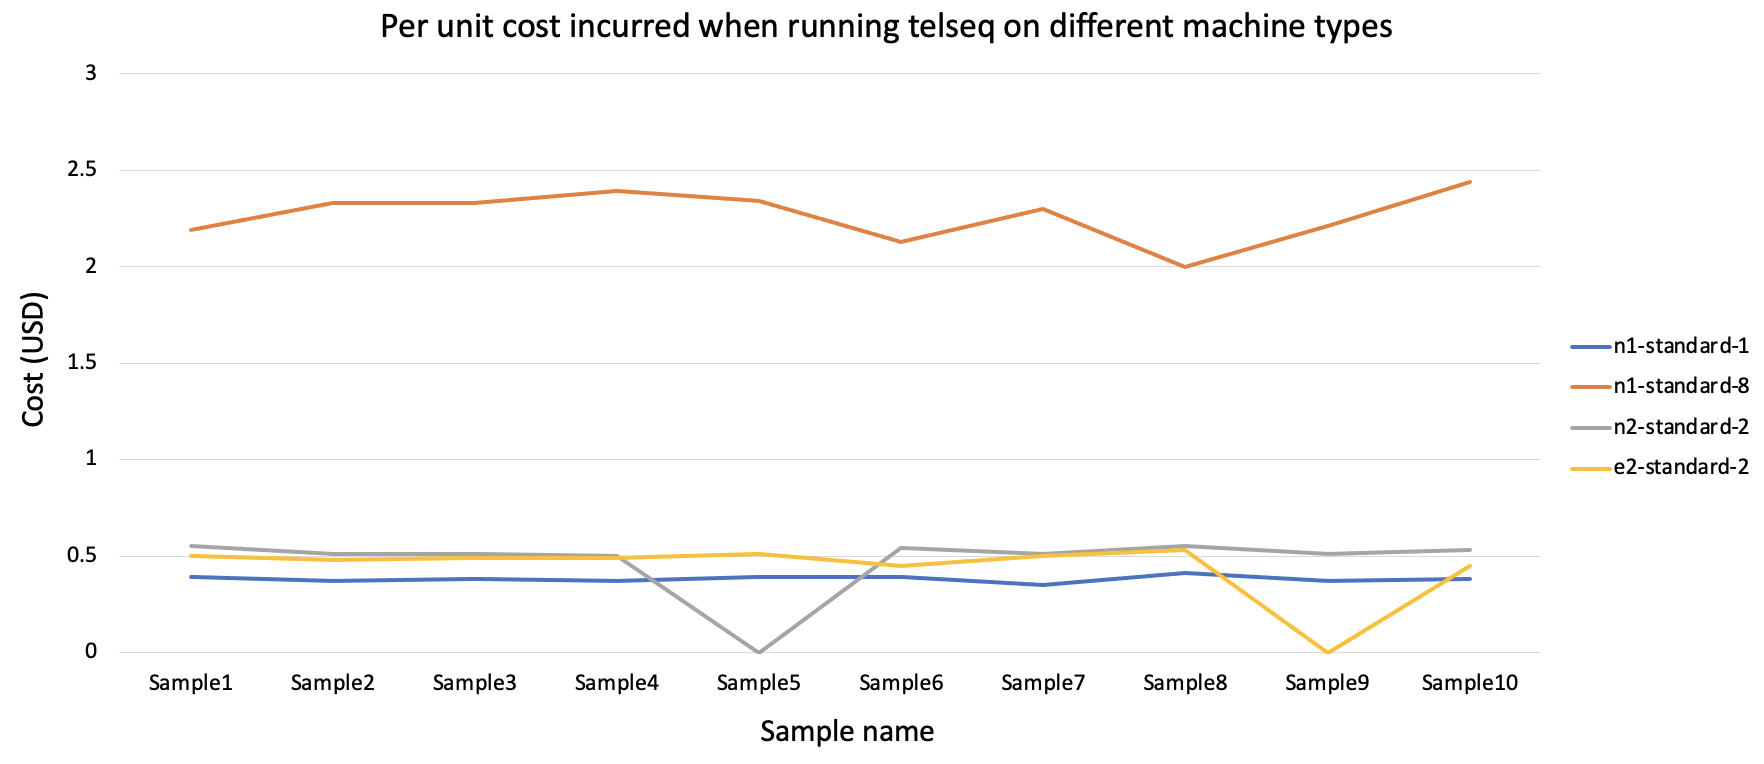
The cost incurred per unit run is the relatively low for n1-standard1 although the runtime is higher than other machine types. For the next round of telseq on 100 samples the n1-standard1 machine type was used.
2. Understanding the relationship between age and telomere length:
The analysis pipeline built is in this notebook. I have also extracted the age, sex and ethnicity information for these 10 samples and merged them with the telseq output on the basis of the SHIP-ID. This way we can build a correlation profile between the Age and the telomere length estimate.
Upon performing pearson correlation, the correlation coefficient was around -0.39. This a moderate negative relationship between telomere length estimate and age, which means that as age increases, the telomere length estimate tends to decrease.
Telseq run on 100 MVP samples
1. Generating a sample set of 100 from a population of 1000 MVP datasets
The goal here is to perform a method of sampling such that we are able to choose a set of 100 samples which will have an distribution that will be representative of the population group. From literature, there are two methods that we could use to do the sampling - Random sampling and Stratified sampling.
-
Random sampling - This is a sampling method where every data point has an equal chance of being in the sample set. This sampling method usually does not have any dependent variables (in this case - Age). I generated a list of 100 samples by running the
random.samplefunction. -
Stratified sampling - Here, the data is first grouped on the basis of a chosen ‘variable’ (Age in this case), following which the sampling is done from each group to ensure that the selected samples have an ‘Age’ distribution that is representative of the population. This way, we can make sure that the sample group accurately represents the the population with respect to the ‘Age’.
In order to identify the best method of sampling for our dataset, we can compare the means between various groups (n=1000, n=100 random sampling and n=100 stratified sampling). The method having a mean closest to the mean of the population would be the best method for sampling. From the results, the mean of stratified sampling aligned closest with that of the population. We will be using the 100 samples generated through this method to run the second round of telseq with n1-standard1 machine type.
More details on how each method of sampling was performed, comparison opf means, and distribution of age before and after sampling can be seen in the notebook under section 2.8.
2. Running telseq on 100 samples
Telseq run completed for the 100 samples chosen through stratified sampling. Before running the 100 samples the telseq script was updated to make sure the output files had the same name as the input crams.
3. Analysis pipeline for the 100 samples
All the analysis performed on the subset of 10 crams were repeated and can be seen in this notebook under section 3.0. The correlation coefficient for the 100 samples is -0.31, again showing a moderate negative relationship between the Age and the telomere length estimate. The correlation values have also been identified after splitting the data on the basis of sex and ethnicity.