#36 MVP Release 2 variants #3: Comparing MVP to gnomAD v3 variants
325,409,090
0.49
0.97
0.72
Frequently Asked Questions
Overview
With release 2 of Million Veteran Program whole genome sequencing data, we’ve identified over 660 million unique variants, or locus and alternate allele combinations. We know that many of these variants are singletons or rare variants. One question we have is: how many of these variants have been observed in other large datasets? To address that, I compared the variants we observed in the Million Veteran Program release 2 with those observed in gnomAD v3, which includes a similar number of variants at 707 million. I used our variant metadata table from Hail as well as the gnomAD v3 public tables which are all available on BigQuery.
| Dataset | Whole genomes | Unique variants | Sequencing coverage |
|---|---|---|---|
| MVP release 2 | 104,923 | 663,351,127 | 30x |
| gnomAD v3 | 76,156 | 707,950,943 | 30-32x |
Table 1. Overview of the MVP and gnomAD datasets I am comparing. gnomAD coverage statistics were obtained from their preprint.
Shared variants between MVP and gnomAD
In order to determine how many variants are shared between MVP and gnomAD, I wrote a SQL query that considers variants to be shared between datasets if they have the same chromosome, position, reference, and alternate bases.Because the gnomAD data is split into separate tables, by chromosome, I used Python code to run this query across all chromosomes and then combine the results.
SELECT COUNT(*) AS shared_variants
FROM `{project_id}.wgs_data_release_2_us.hail_variant_info` AS hail
INNER JOIN `bigquery-public-data.gnomAD.v3_genomes__chr{chromosome}` AS gnomad
    ON hail.contig = 'chr{chromosome}'
    AND hail.position = gnomad.end_position
    AND hail.alleles[0] = gnomad.reference_bases
    AND hail.alleles[1] = (SELECT alt FROM UNNEST(gnomad.alternate_bases))
I also wrote queries to count the total number of variants in MVP and gnomAD as well as for each chromosome. The summary of that information is here. Of the 663 million MVP variants, 325 million (49%) have also been observed in gnomAD v3.
| Chromosome | MVP variants | gnomAD variants | Shared variants |
|---|---|---|---|
| All | 663,351,127 | 707,950,943 | 325,409,090 |
Table 2. Comparison of variant counts between MVP release 2 and gnomAD v3.
In Figure 1, you can also see the breakdown by chromosome. Across the autosomes there is a consistent pattern of gnomAD including slightly more variants than MVP. This is somewhat surprising given that gnomAD included 71,402 samples while we have 104,923. My guess is that this is due to us using for quality thresholds for including variants. The pattern is slightly reversed for the sex chromosomes where we see more variants than gnomAD.
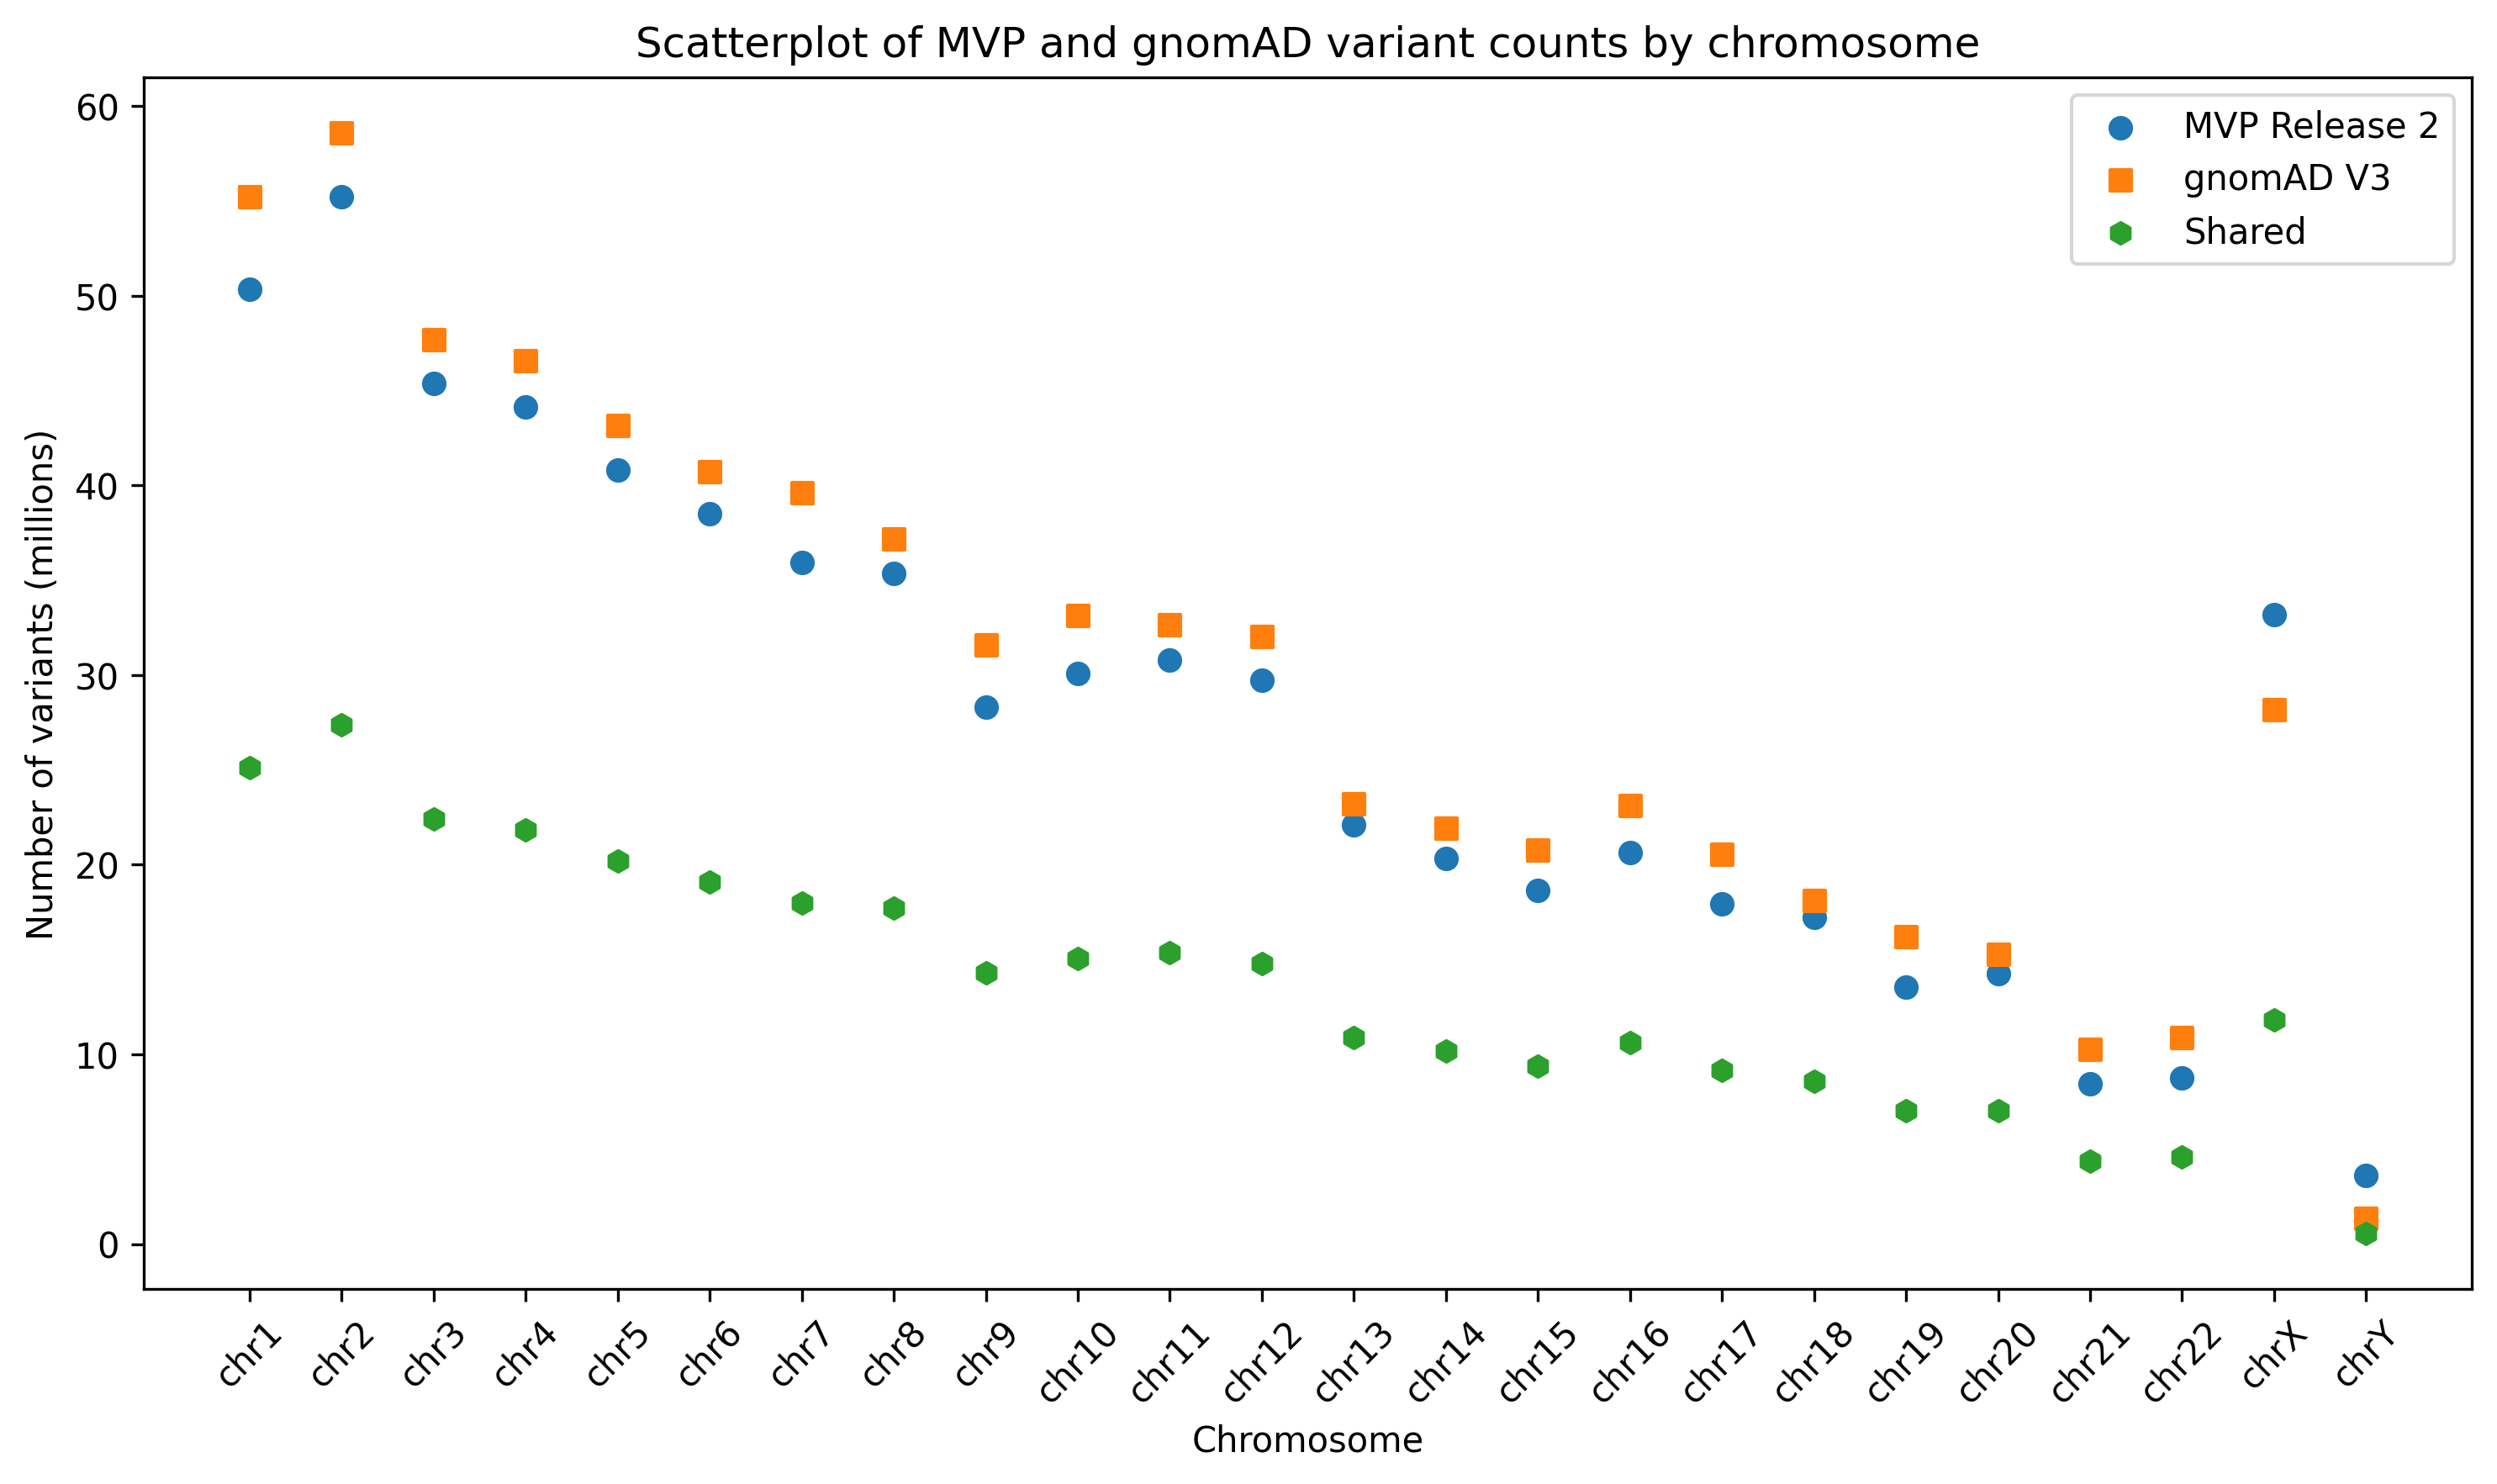 Figure 1. Scatterplot of shared variant counts between MVP release 2 and gnomAD v3, stratified by chromosome.
Comparing allele counts between MVP and gnomAD
Given that we see about 50% of the MVP variants in gnomAD, another question I had was whether those alternate alleles occurred at similar rates between MVP and gnomAD. To investigate this, I compared allele counts of shared variants between datasets. I did this by creating a temporary table to stored alternate allele counts for shared variants.
CREATE OR REPLACE TABLE `{project_id}.wgs_data_release_2_us.temp_mvp_gnomad_allele_counts` AS
SELECT
  hail.contig AS chromosome,
  hail.position AS start_site,
  hail.alleles[1] AS alternate_allele,
  hail.variant_qc_AC[1] AS mvp_alt_allele_count,
  (SELECT AC FROM UNNEST(gnomad.alternate_bases)) AS gnomad_allele_count
FROM `{project_id}.wgs_data_release_2_us.hail_variant_info` AS hail
JOIN `bigquery-public-data.gnomAD.v3_genomes__chr1` AS gnomad
ON hail.contig = gnomad.reference_name
  AND hail.position = gnomad.end_position
  AND hail.alleles[1] = (SELECT alt FROM UNNEST(gnomad.alternate_bases))
I then subsamples 10,000 variants from chromosome 1 to generate a scatterplot describing alternate allele counts between datasets (Figure 2).
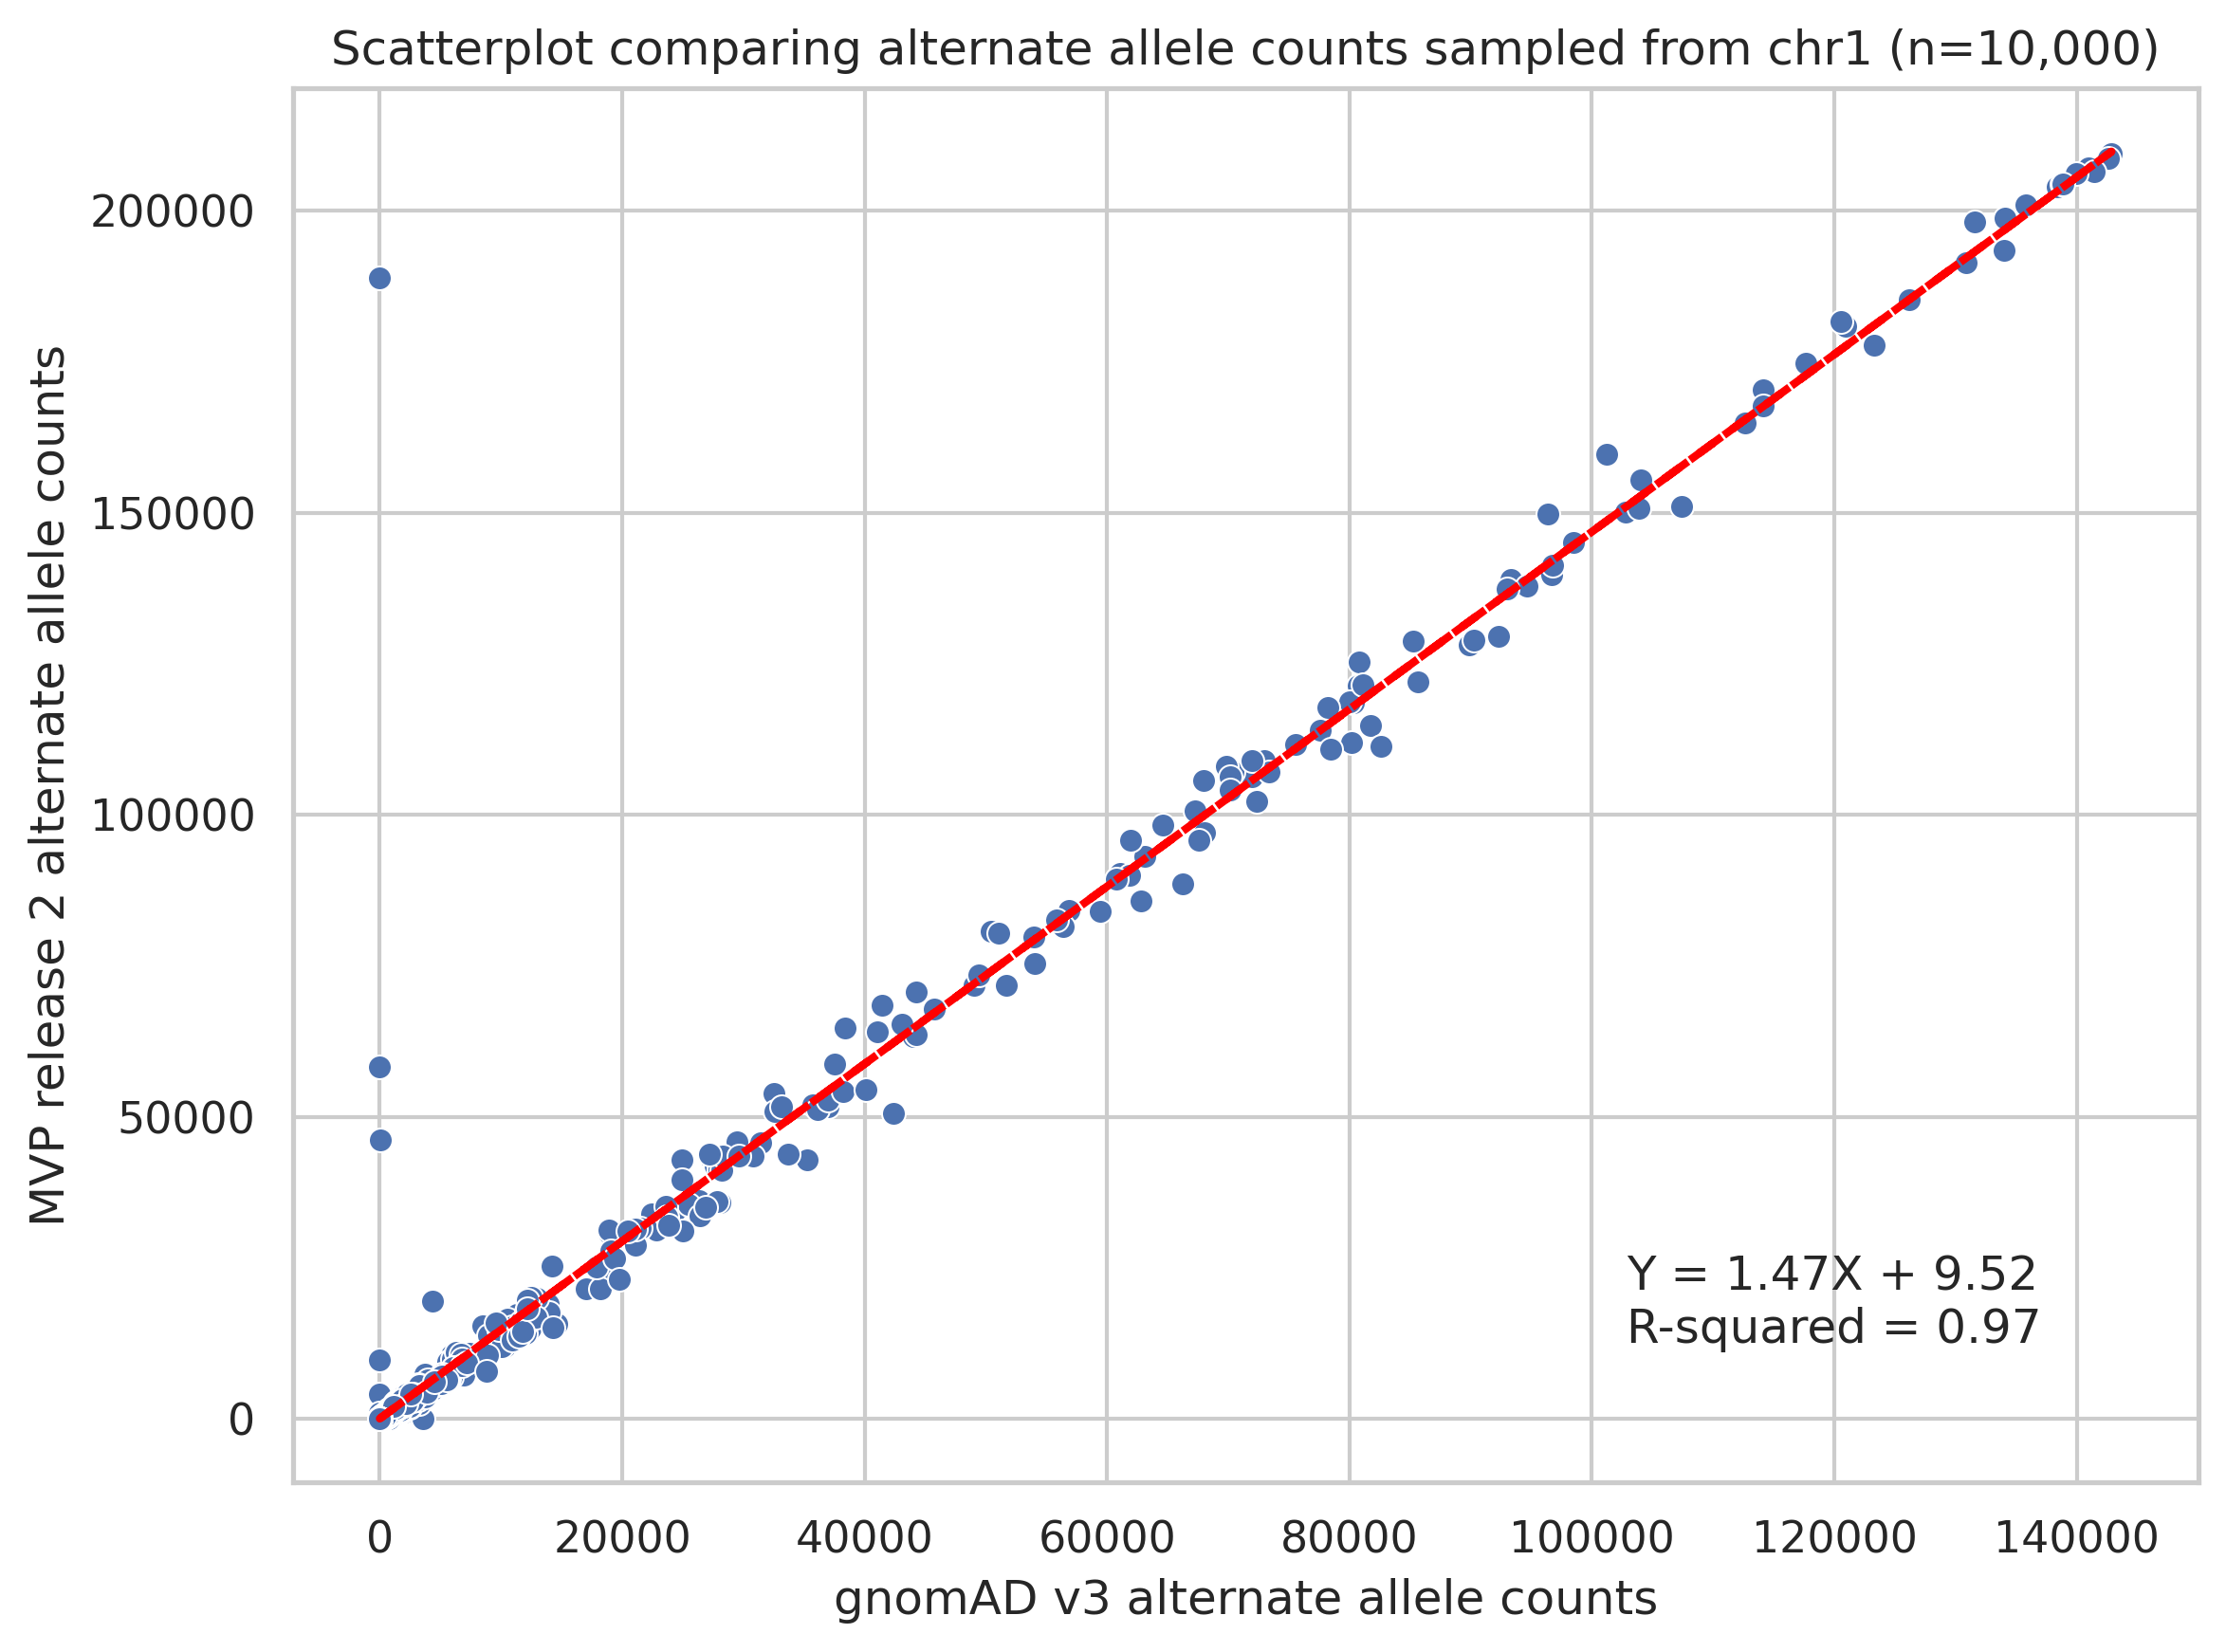 Figure 2. Scatterplot of alternate allele counts of variants shared between MVP and gnomAD datasets.
I also created a scatterplot on a log scale so that you can get a better view of variants that have low alternate allele counts.
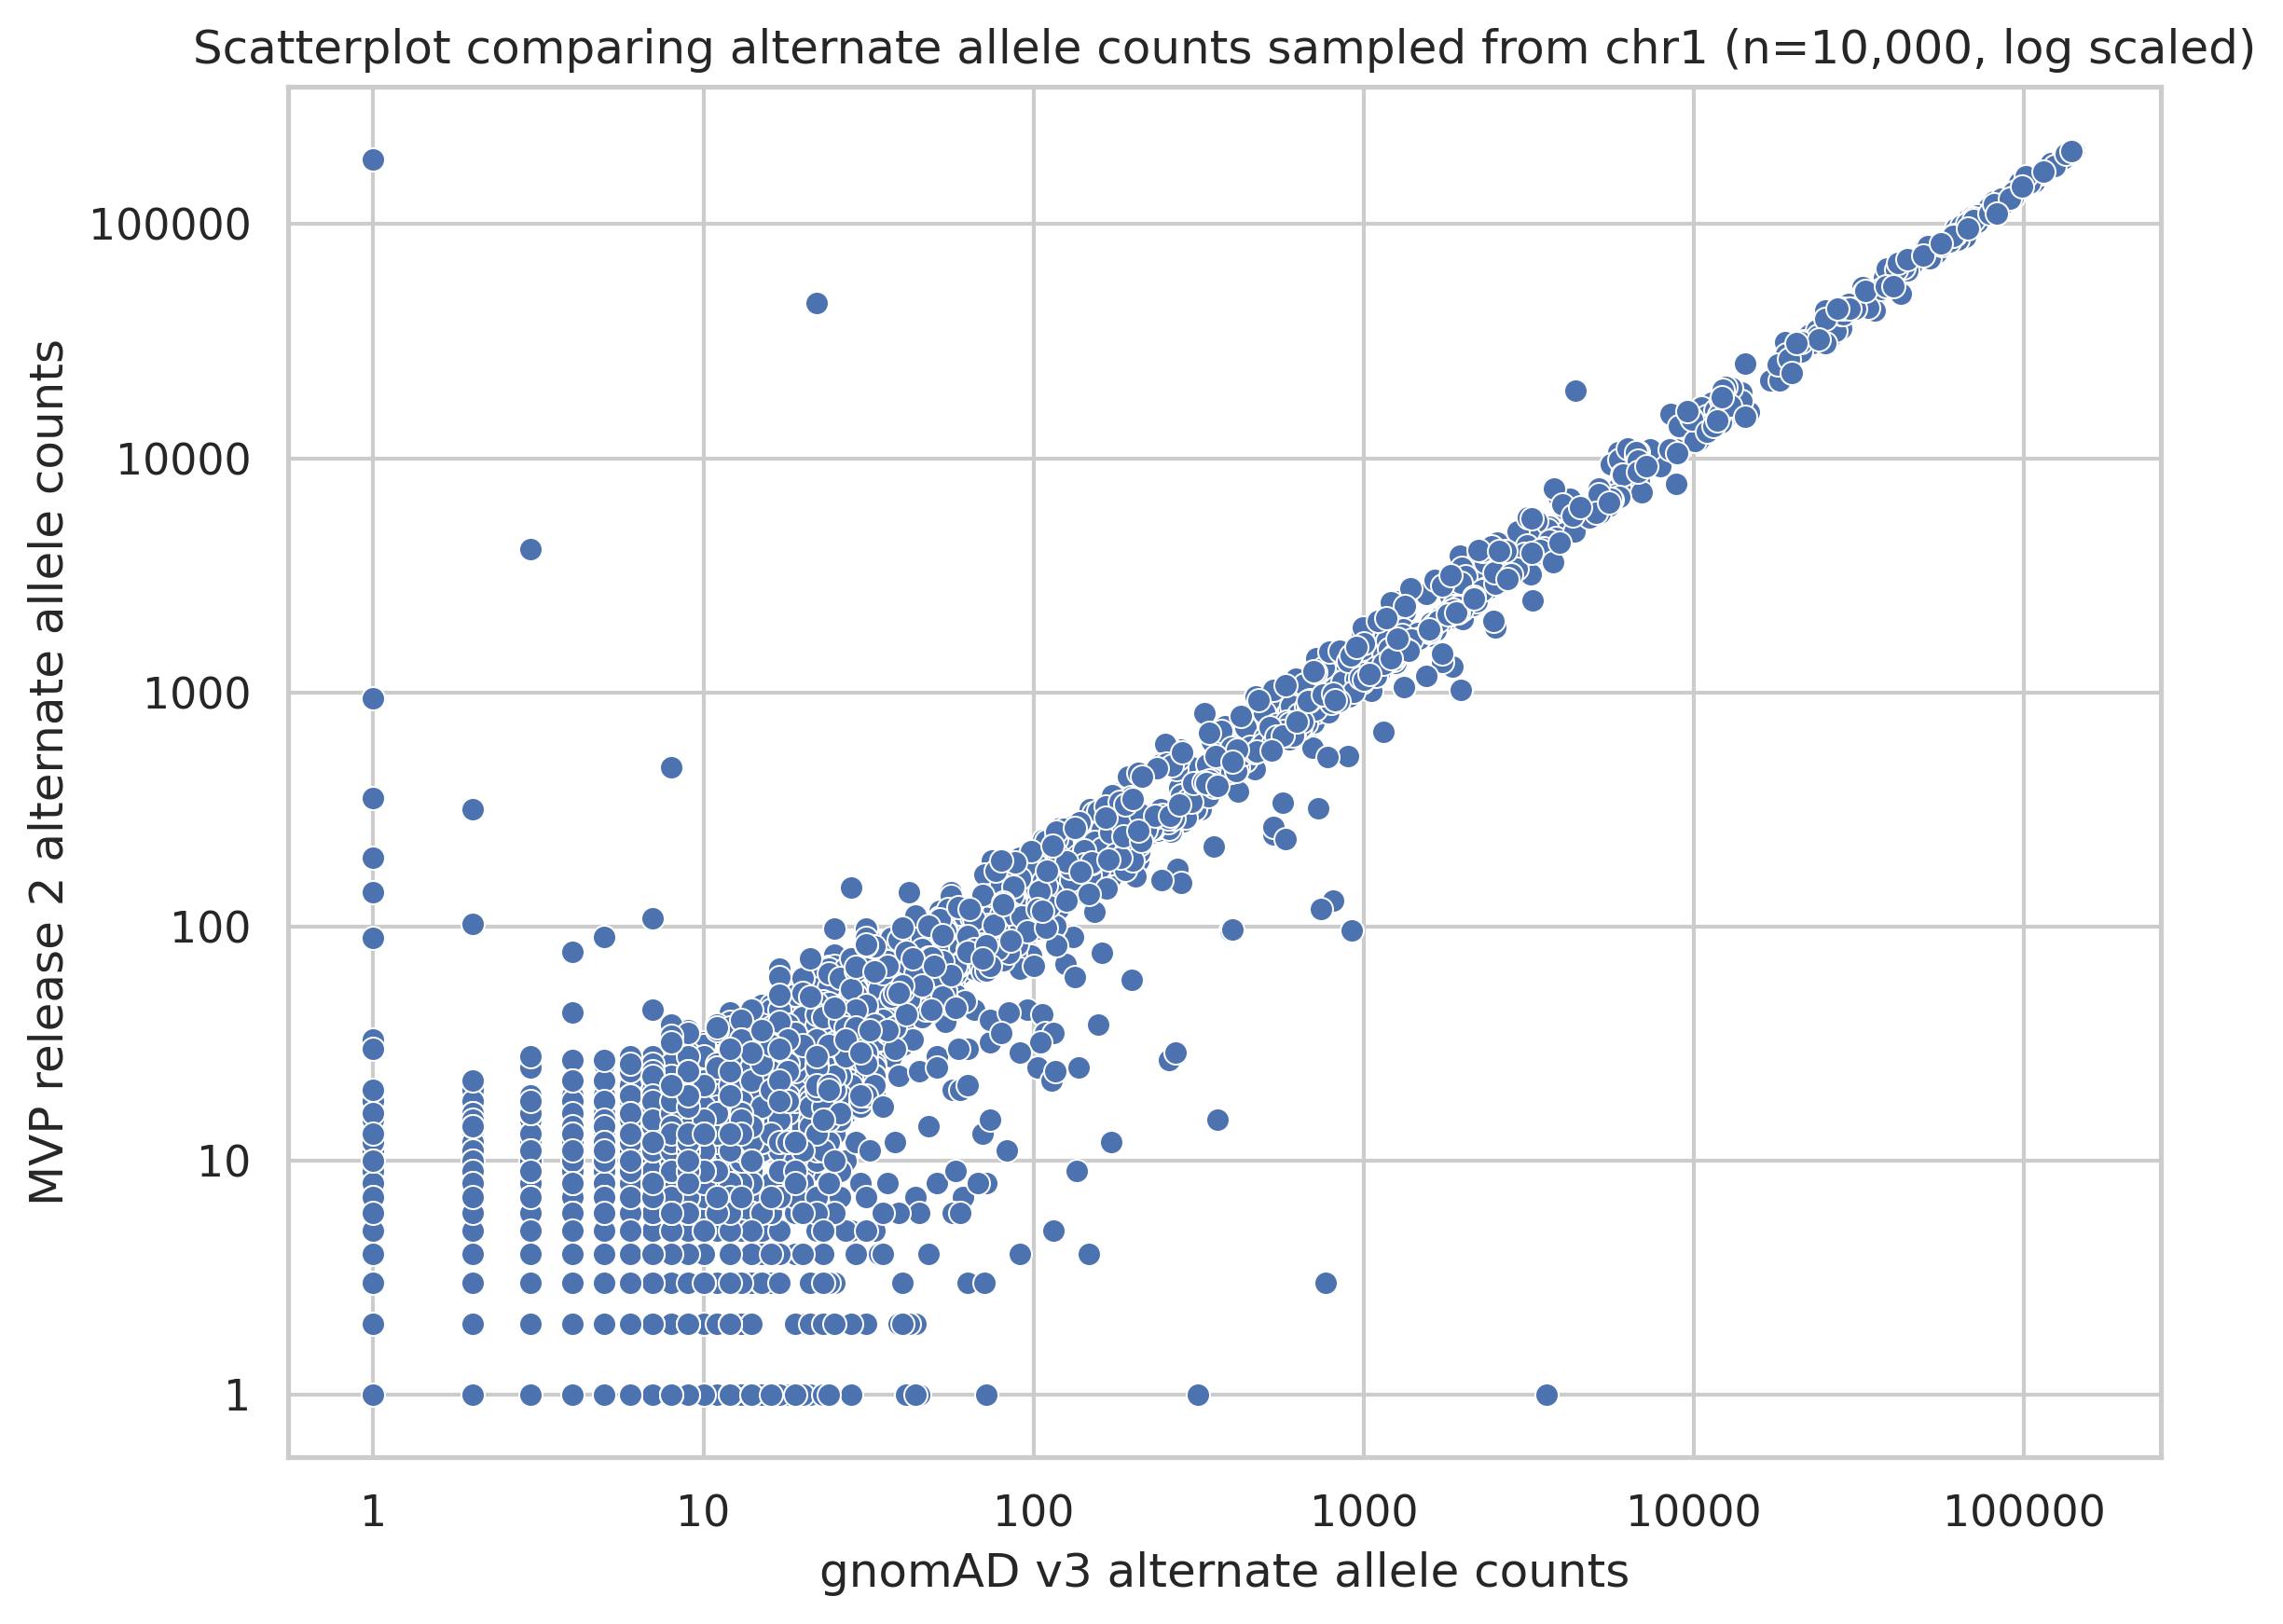 Figure 3. Scatterplot of alternate allele counts of variants shared between MVP and gnomAD datasets.
Overall, I would say there is high concordance of allele counts between the datasets.
Comparing allele counts excluding singletons
We know that a lot of the variants in MVP are singletons or rare variants. Given the low frequency of these variants I expected low overlap of these variants between MVP and gnomAD. To investigate this, I reran a similar analysis while excluding singletons. Without singletons, we see 72% of MVP release 2 variants in the gnomAD v3 dataset. We also see a significant enrichment of variants on the X chromosome in MVP compared to gnomAD. We are not sure if this is due to differences in filtering criteria or some other factor, but we will continue to investigate.
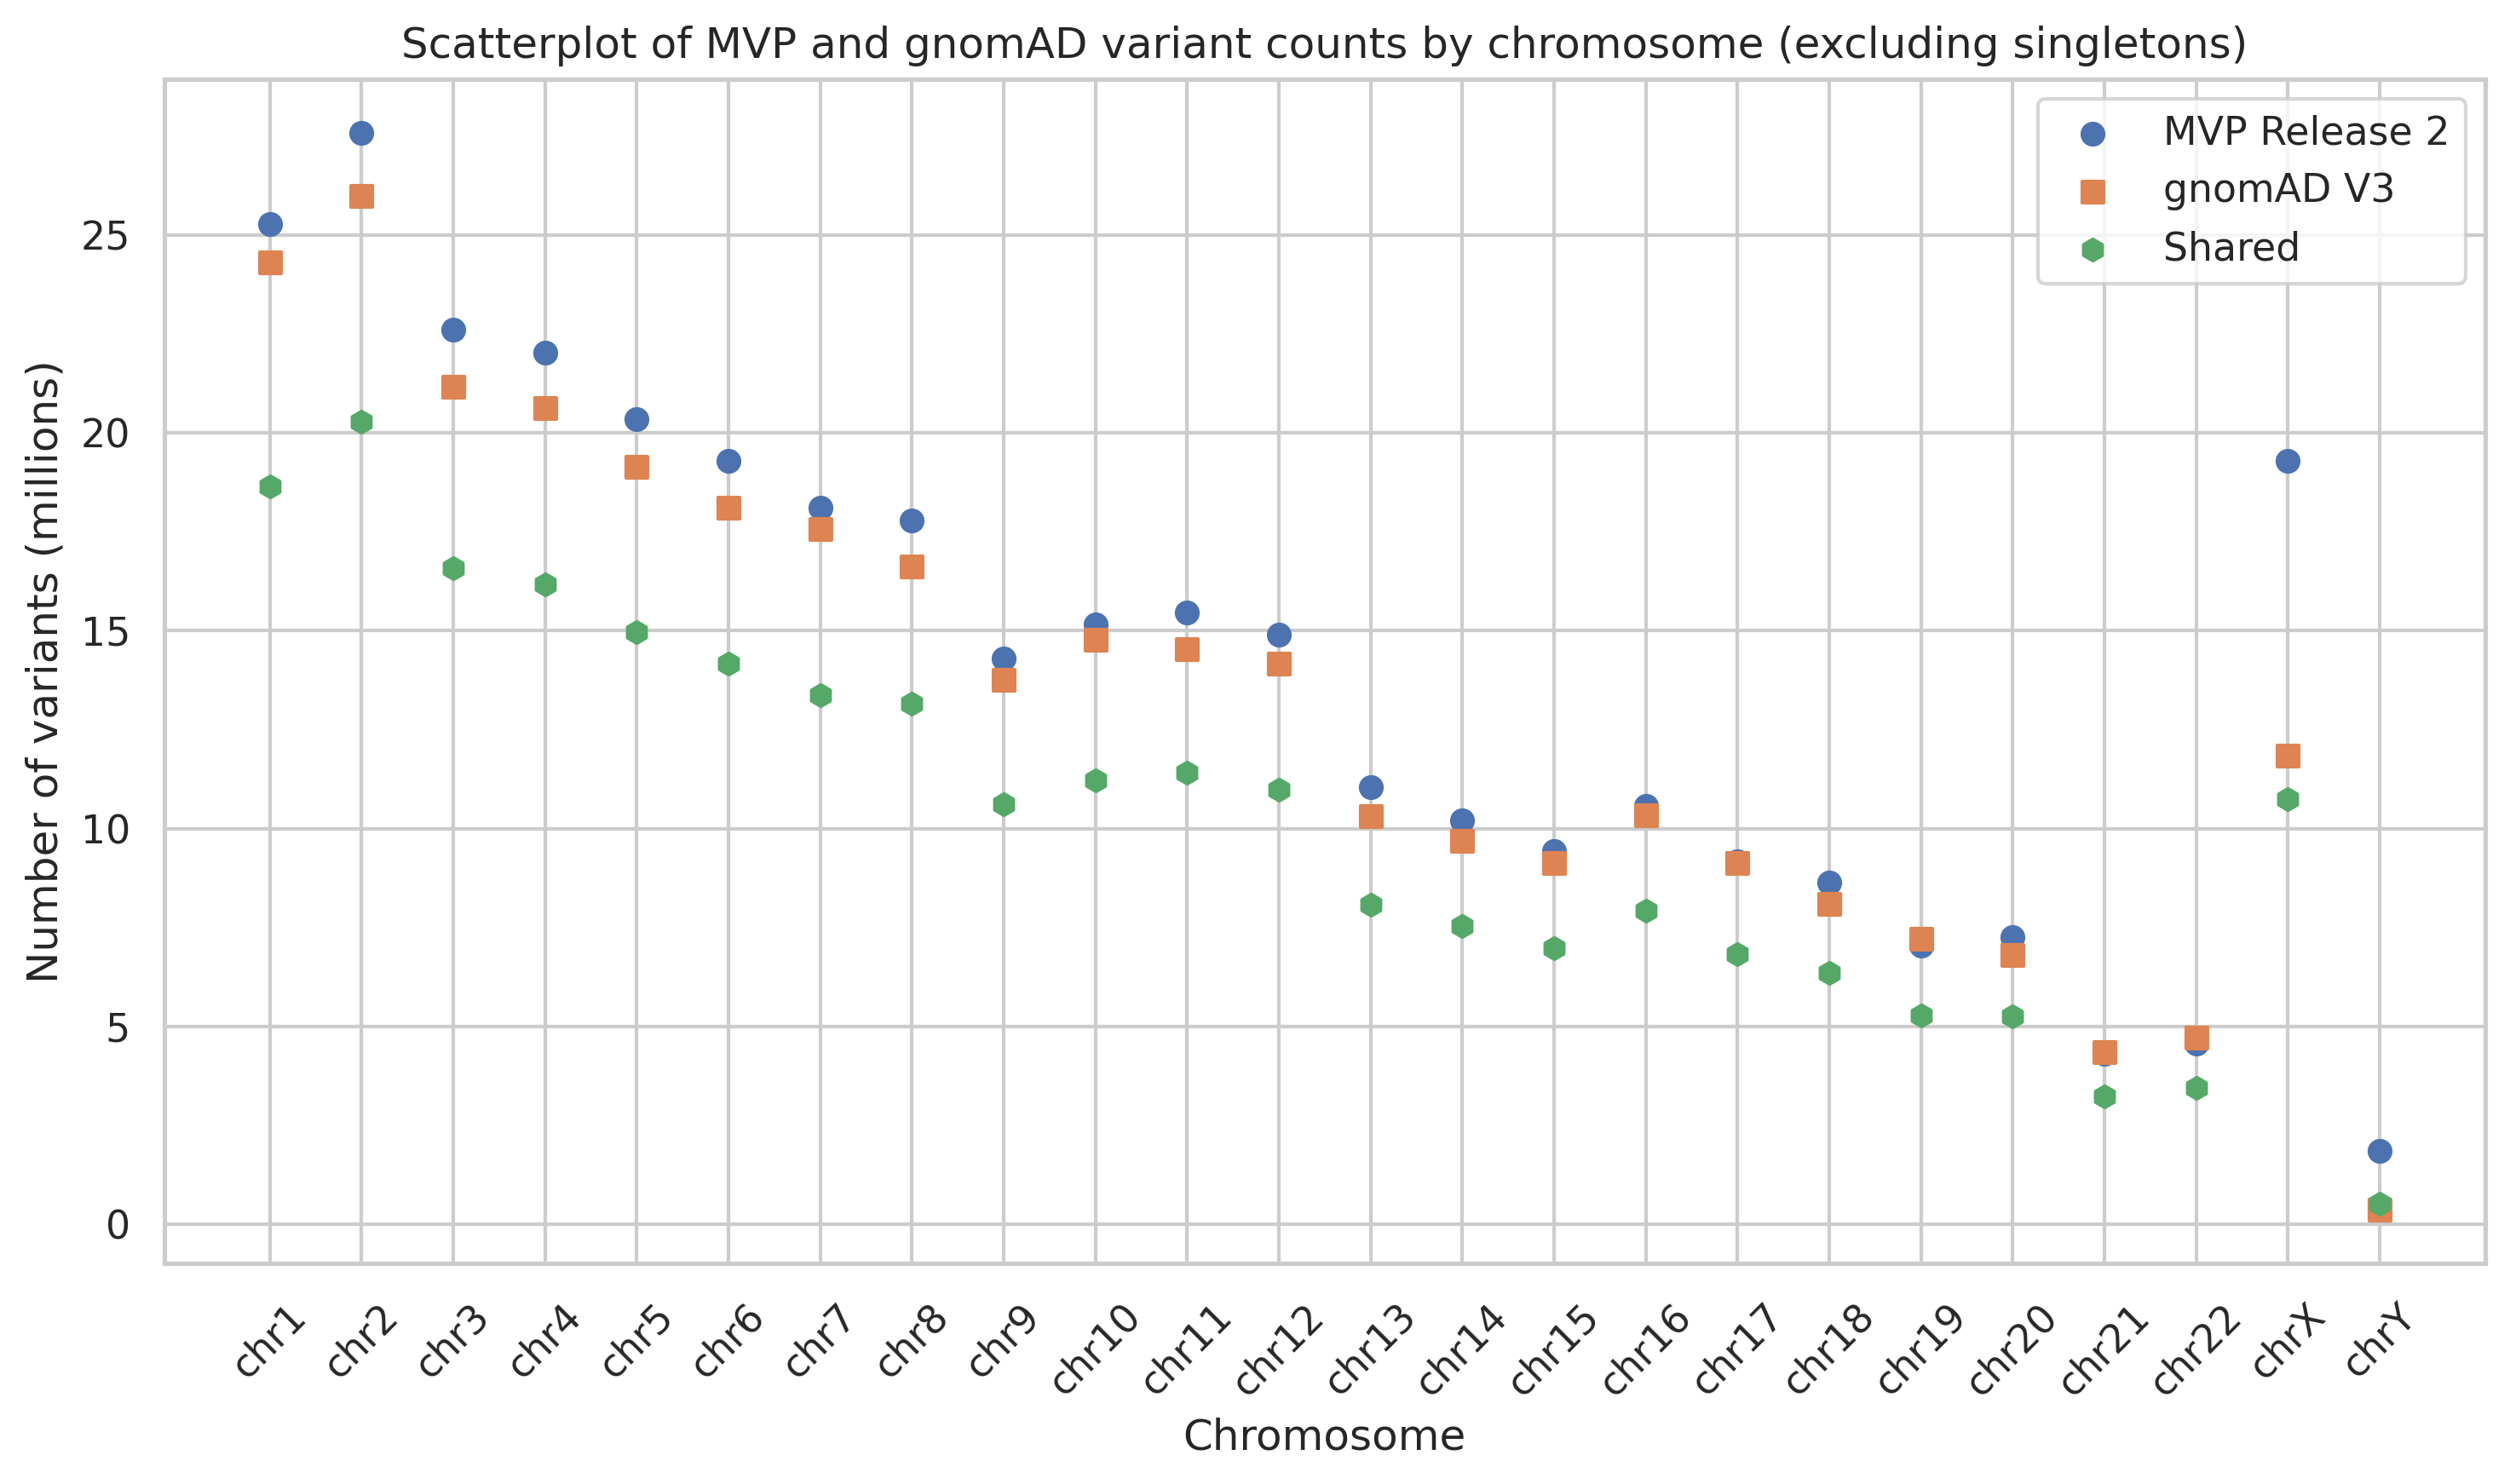 Figure 4. Scatterplot comparing variant counts between MVP release 2 and gnomAD v3, stratified by chromosome and excluding singletons.
| Chromosome | MVP variants | gnomAD variants | Shared variants |
|---|---|---|---|
| All | 336,227,251 | 312,793,823 | 243,680,654 |
Table 3. Comparison of variants counts, excluding singletons, between MVP and gnomAD.
Code
Our team members can find the source notebook with code and descriptions of these analyses in our internal repository.
Discuss
Join the discussion of this post on GitHub!