#42 Results from LTL estimation on 103,763 WGS genomes and CHIP calling on 100 genomes
Telomere length estimation in MVP WGS data
Leukocyte telomere length estimation for 103,763 MVP WGS genomes has been completed. The analysis notebook will soon be uploaded to the mvp-telomere-analysis git repo. Regarding the number of genomes:
- 8562 genomes from LTL Pilot study are not a part of WGS DR2.
- 808 genomes that were a part of WGS DR2 were not a part of the LTL study.
Sample count:
| Number of genomes in WGS DR2 | 104,923 |
| Number of genomes that have demographic information | 104,901 |
| Number of genomes in LTL Pilot study | 84,677 |
| Number of genomes in LTL 2nd run | 31,873 |
| Number of missing ID’s between WGS DR2 and LTL | 808 |
| Number of genomes in TelSeq 3rd run | 788 (808-20) |
Note: 20 genomes from WGS DR2 do not have cram locations available.
1. Filteration:
- In total, Telomere length estimation has been completed for 117,338 genomes.
- After removing the 8562 genomes (samples in Telseq Pilot but NOT a part of WGS DR2), the number drops down to 108,776.
- From the 108776, the number of genomes common between WGS DR2 and TelSeq = 104,903.
Hare distribution within the 104,903 genomes:
| hare | count |
|---|---|
| EUR | 72,916 |
| AFR | 24,612 |
| ASN | 5,548 |
| HIS | 687 |
| NA | 1118 |
- NA (1118) samples have been removed for all subsequent analysis, dropping the number to 103,763.
- 22 genomes do not have any demographic information.
2. Distribution of ‘Age’
2.1. Across 103,763 MVP WGS genomes
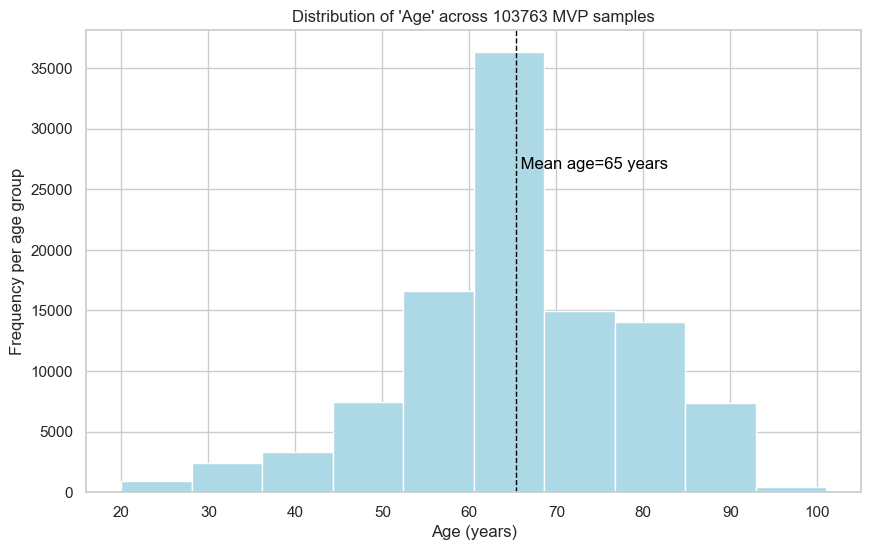
| Pilot study | Final study | |
|---|---|---|
| Mean age | 65 years | 65 years |
| Standard deviation | 14 years | 13 years |
| Minimum age | 20 years | 14 years |
| Maximum age | 101 years | 99 years |
3. Distribution of estimated LTL across 103,763 MVP WGS genomes
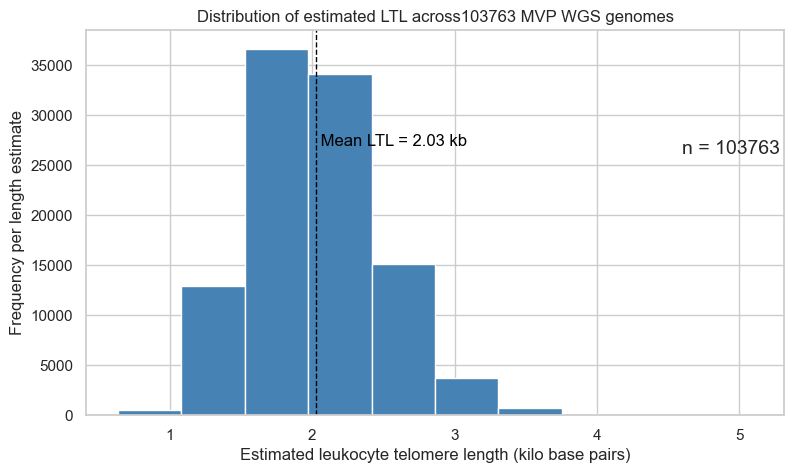
Mean LTL for the Pilot study was 2.02kb.
4. Correlation between ‘Age’ and ‘LTL’
4.1. Across all 103,763 genomes
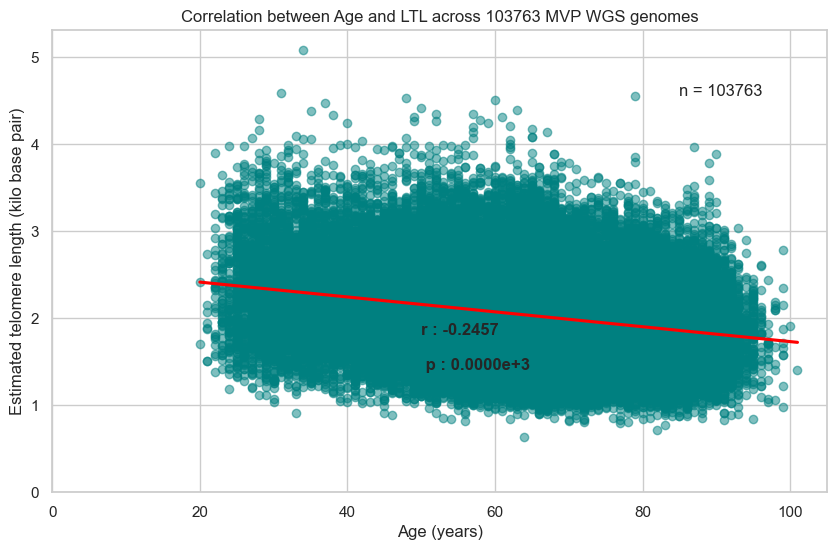
Correlation co-efficient between Age and LTL in the Pilot study = -0.26 (p value < 1e-16)
4.2. Stratified by Sex
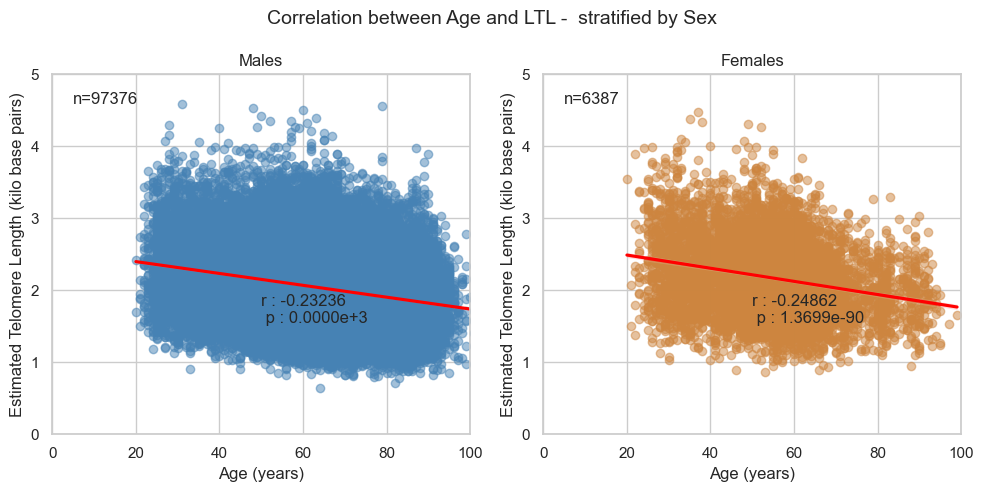
Correlation co-efficient between Age and LTL in the Pilot study for each sex:
- Male = -0.24 (p value < 1e-16)
- Female = -0.24 (p value = 4.8252e-68)
4.3. Stratified by HARE
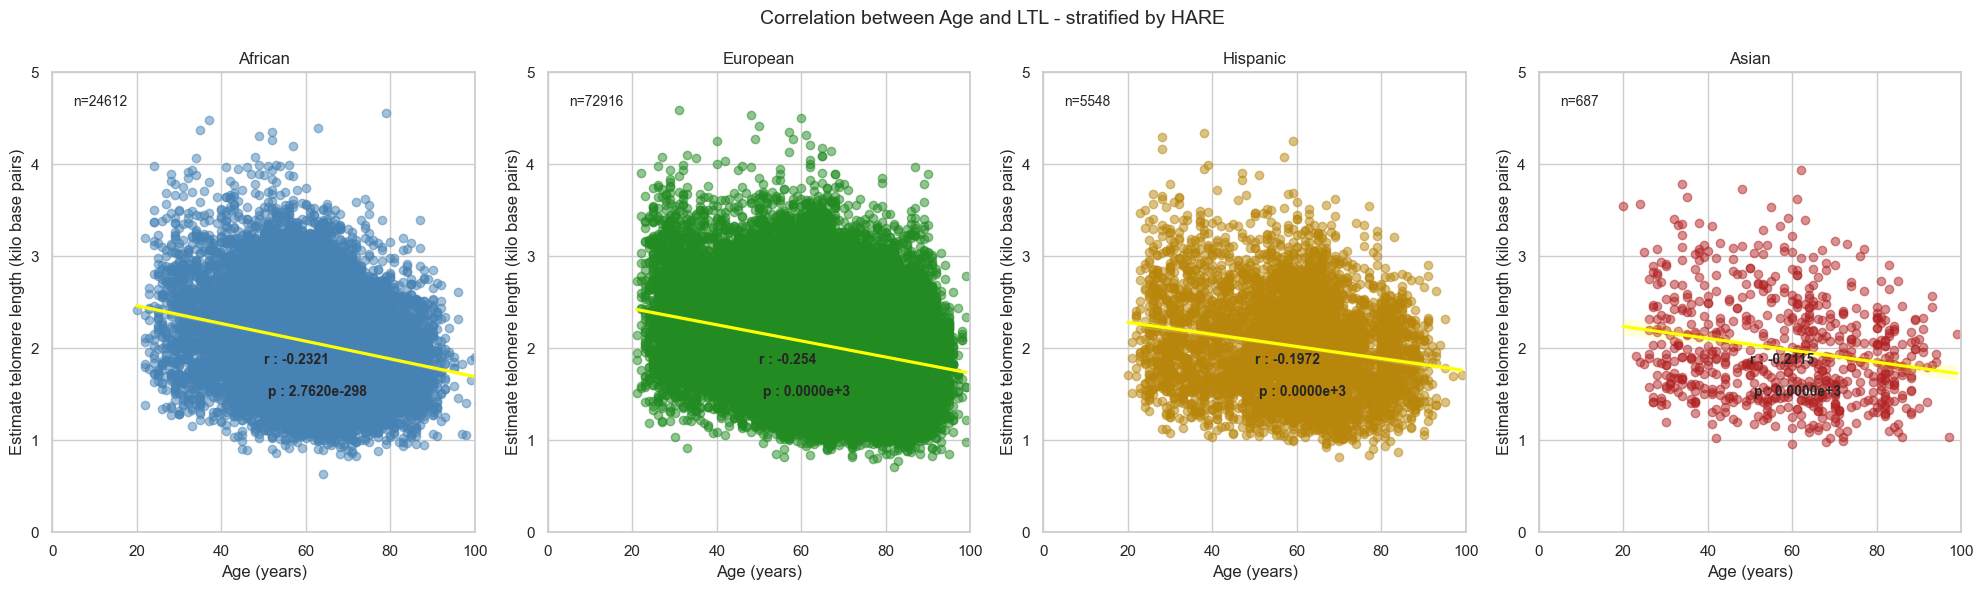
Correlation co-efficient between Age and LTL in the Pilot study for each HARE group:
- AFR = -0.23 (p value = 1.36e-225)
- EUR = -0.27 (p value <1e-16)
- HIS = -0.22 (p value <1e-16)
- ASN = -0.21 (p value <1e-16)
5. Comparing estimated LTL across 103,763 genomes
5.1. Stratified by Sex
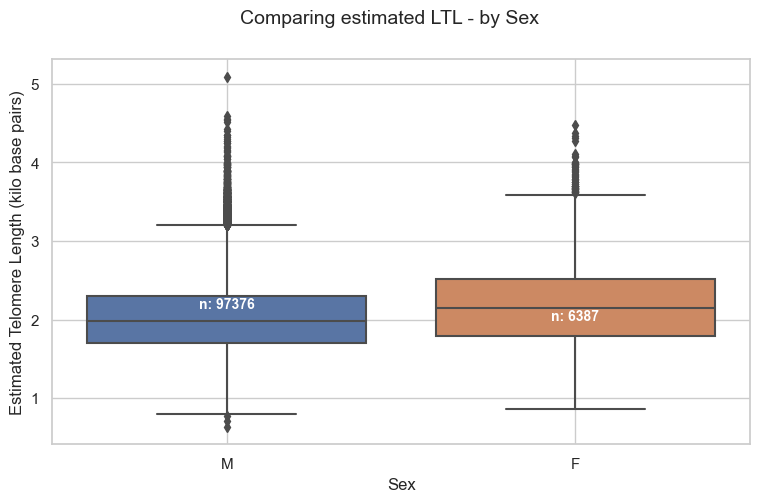
Mean estimated LTL in Pilot study, by sex:
- Male = 2.01kb
- Female = 2.16kb
5.2. Stratified by HARE
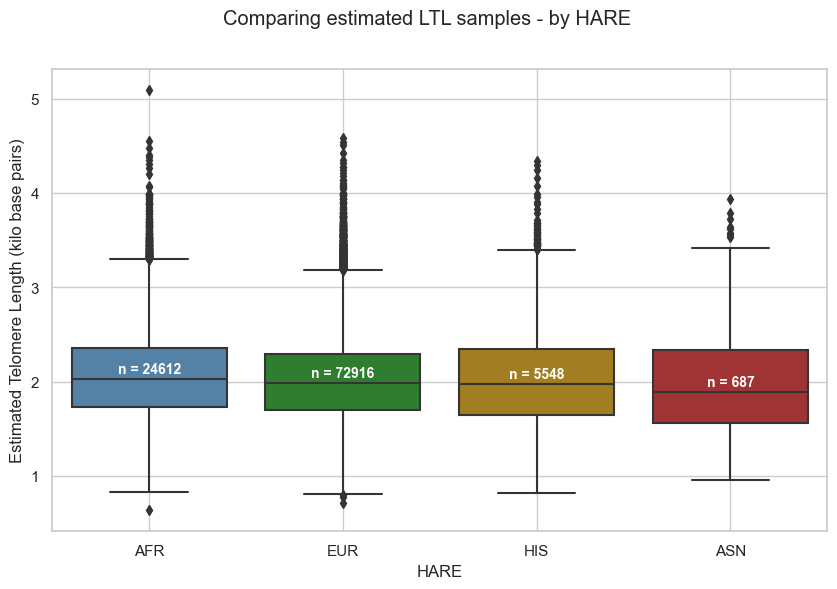
Mean estimated LTL in Pilot study, per HARE group:
- AFR = 2.07kb
- EUR = 2.01kb
- HIS = 2.03kb
- ASN = 2.0kb
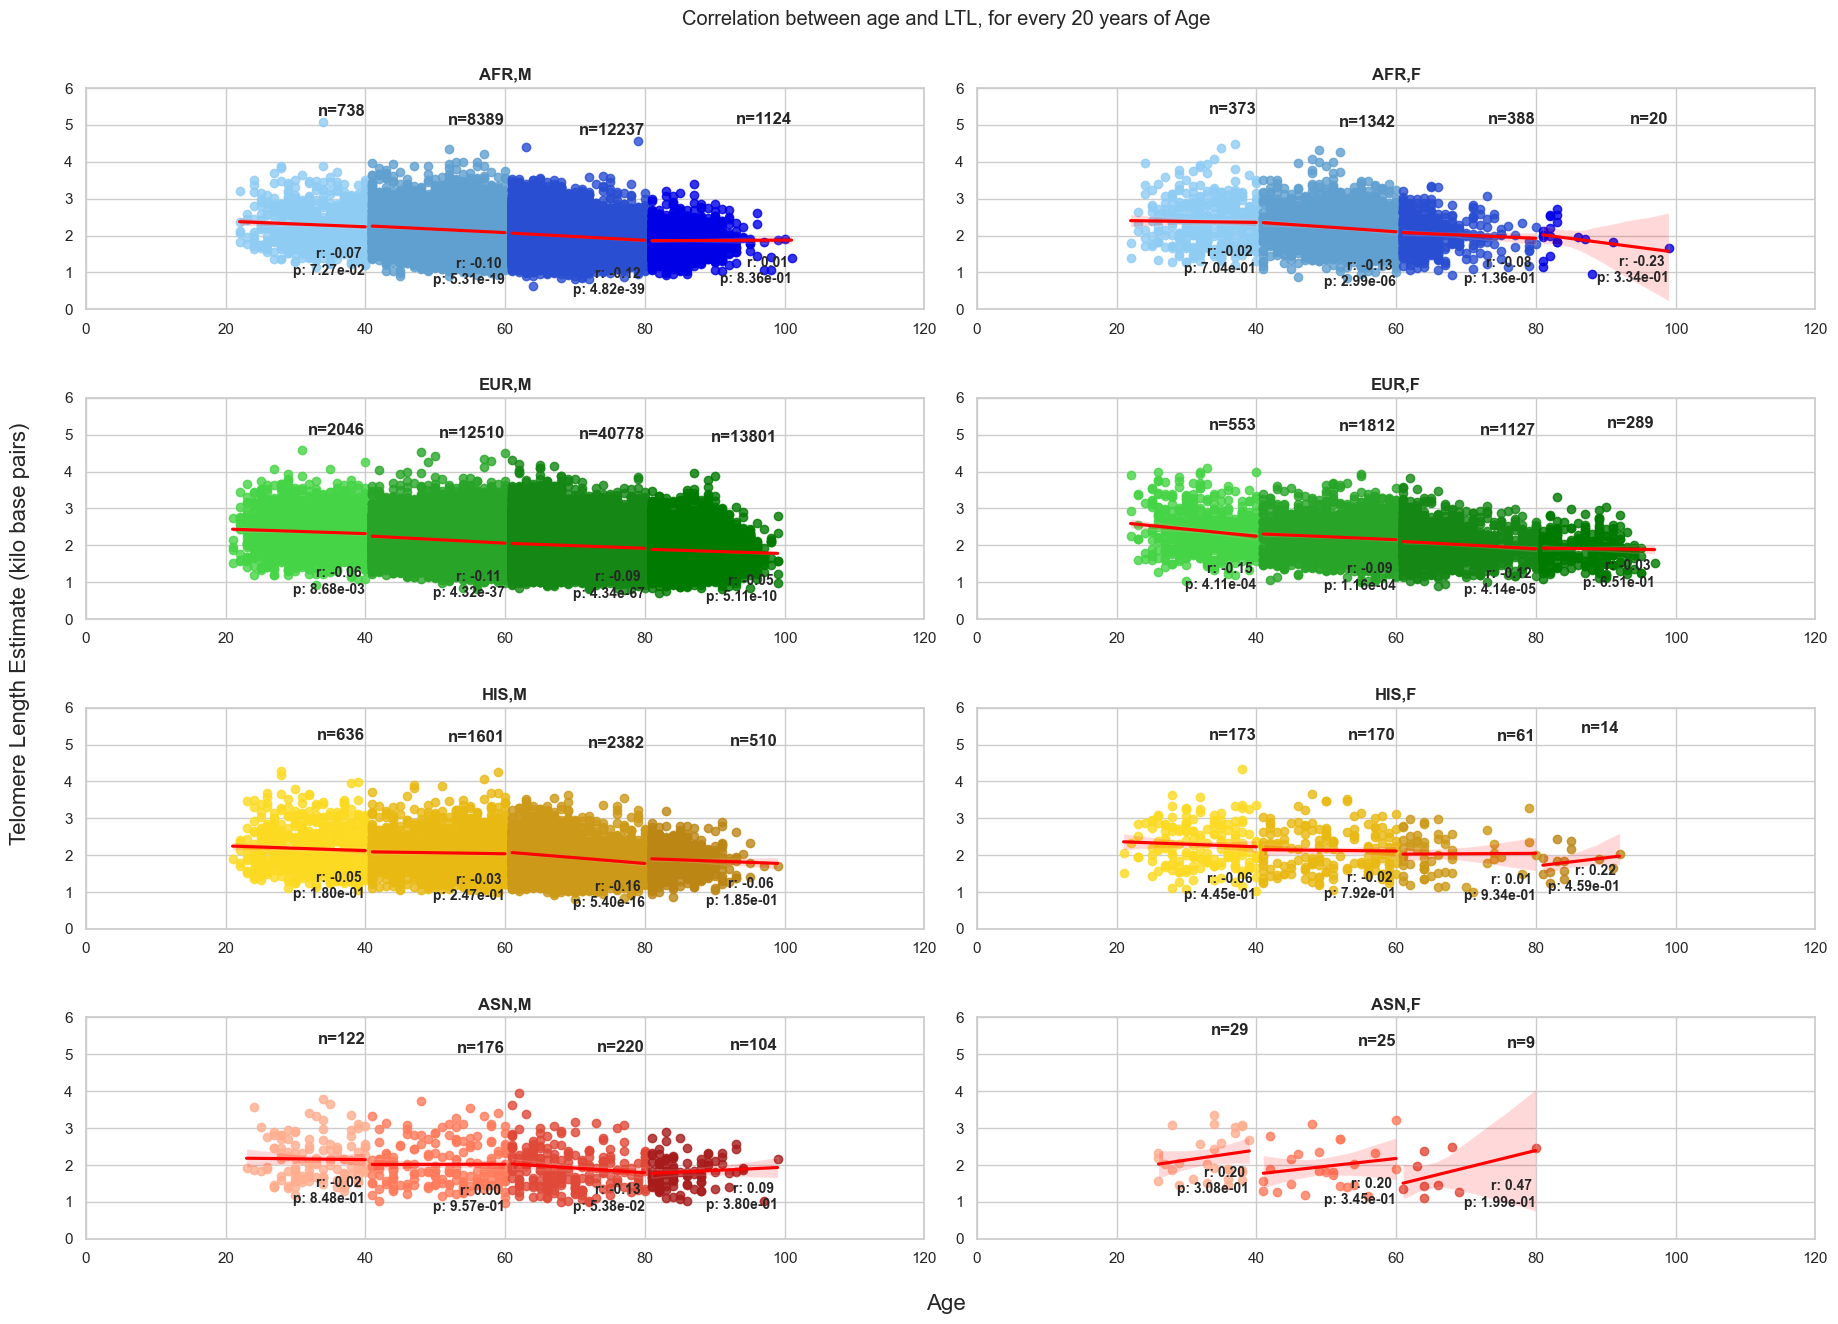
6. Variation in correlation between Age and estimated LTL, every 20 years
Next steps:
- Push completed notebook and figures to the GitHub repository
- Share telomere results with DACS team
CHIP calling in MVP WGS data
GATK Mutect2 pipeline has been successfully completed for 100 genomes. The pipeline was executed using the docker image broadinstitute/gatk:latest. The docker image is bulky as it contains all the tools that are a part of the GATK suite, and hence requires a ‘boot-disk-space’ allocation of 20Gb. Along with this, the tool also requires a reference dictionary file used to describe a reference genome assembly. The other depencies include the input CRAM, index CRAI file, reference fasta file, list of CHIP driver genes and the germline resource file which is a population VCF of germline sequencing containing allele fractions.
Mutect2 script
#!/bin/bash

#Extract file name
export CRAM_NAME="$(basename $CRAM .cram).vcf"

#Run Mutect2
gatk Mutect2 \
    -I $CRAM \
    -L $CHIP_GENES \
    -R $REF \
    --germline-resource $GERM_RES \
    --genotype-germline-sites \
    -O "$(dirname "${OUTPUT}")/${CRAM_NAME}"
dsub job script
dsub \
--provider google-v2 \
--project PROJECT_ID \
--regions us-west1 \
--machine-type n1-standard-1 \
--logging gs://PATH/TO/LOG/ \
--name chip_mvp \
--image broadinstitute/gatk:latest \
--boot-disk-size 20 \
--task "gs://PATH/TO/task.tsv" \
--script "gs://PATH/TO/mutect2_script.sh"
Tab-seperated task file
The TSV file utilized in the batch dsub script serves as a structured data input file, containing tab-separated values organized in rows and columns. Each row represents a distinct task or job to be executed by the dsub command, with each column corresponding to specific parameters or attributes associated with the tasks. For ease of reading the file has been transformed here. Ideally, column1 (Parameter) woud be row1 and column2 (File path) would be row2.
| Parameter | File path |
|---|---|
| –input CRAM | gs://PATH/TO/.cram |
| –input CRAI | gs://PATH/TO/.cram.crai |
| –input CHIP_GENES | gs://PATH/TO/CHIP_NEJM2017_74genes.bed |
| –input GERM_RES | gs://gatk-best-practices/somatic-hg38/af-only-gnomad.hg38.vcf.gz |
| –input GERM_RES_INDEX | gs://gatk-best-practices/somatic-hg38/af-only-gnomad.hg38.vcf.gz.tbi |
| –input REF | gs://genomics-public-data/resources/broad/hg38/v0/Homo_sapiens_assembly38.fasta |
| –input REF_FAI | gs://genomics-public-data/resources/broad/hg38/v0/Homo_sapiens_assembly38.fasta.fai |
| –input REF_DICT | gs://genomics-public-data/resources/broad/hg38/v0/Homo_sapiens_assembly38.dict |
| –output OUTPUT | gs://PATH/TO//Output/*.vcf |
VCF files for the initial 100 samples have been generated and are on GCS. The next steps would be:
- Extract Mutect2 compute time for 100 genomes from the log files.
- Cost estimation for 100 samples.
- Update CHIP calling GitHub repository with scripts.
- Share results for pilot with Alex and team to discuss next steps.
Join the discussion here!